from pandas import json_normalize
import requests
import plotly.express as px
import plotly.io as pio
pio.renderers.default = "plotly_mimetype+notebook_connected"
import base64
from IPython.display import Image, display

def mm(graph):
    graphbytes = graph.encode("ascii")
    base64_bytes = base64.b64encode(graphbytes)
    base64_string = base64_bytes.decode("ascii")
display(Image(url="https://mermaid.ink/img/" + base64_string))2 Albums, dates and popularity
In this part I’m going to work with the /albums/{id} API section which return all the information Spotify has of an album. I use this data to answer questions like:
- Does the era affect the amount of tracks that an album had?
- The popularity of an album is it affected by the era?
- The number of tracks it’s related to the popularity of the album?
Remember that the analysis of the first part was done with a small sample of artist data, so far we have the following partial conclusions:
The most popular year for Rush was 1981 and this popularity is related to the fact that it was the time when they released the most albums.
Most Rush tracks exceed 5 minutes in length and are not as popular as the shorter ones.
As of 2020 Rush continued to release albums, but none of these had the popularity of Moving Pictures in 1981.
2.1 API
A small summary of the functionalities that I will use:
GET /albums/{id}/albums?market=US| Parameter | Type | Description |
|---|---|---|
| id (required) | string |
The ID of the album |
2.2 Libraries
Import the libraries I will need:
This is the section of the authentication and generation of the token that was already explained in the first section
CLIENT_ID = '81e800e81ecf4997b5b9fb12efeb3ff2'
CLIENT_SECRET = '0e4364f440f148779d8a9f17976ecf1b'
def get_token():
    url = 'https://accounts.spotify.com/api/token'
    auth_response = requests.post(url, {
        'grant_type': 'client_credentials',
        'client_id': CLIENT_ID,
        'client_secret': CLIENT_SECRET,
    })
    if auth_response.status_code != 200:
        raise Exception('Error getting token')
    else:
        auth_response_data = auth_response.json()
        return auth_response_data['access_token']
access_token = get_token()
header = {
    'Authorization': 'Bearer {token}'.format(token=access_token),
    'accept':'application/json'
}
base_url = 'https://api.spotify.com/v1/'
To obtain a dataframe with the albums of an artist, a few previous steps must first be carried out:
1- Ask the user for the artists. 2- Get the artist ID 3- Extract all the albums of the artist.
Steps one and two were already explained in the first section:
#ask for user input for artist name
artist_name = input('Enter artist name: ')
print('the artist name is: ', artist_name)
#get artist id
artist_id = requests.get(base_url + 'search?q={}&type=artist'.format(artist_name), headers=header).json()['artists']['items'][0]['id']
the artist name is: Rush2.3 Workflow
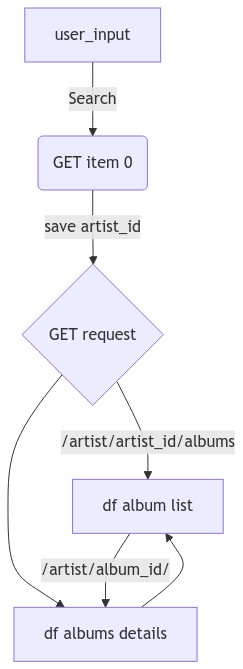
The workflow from when the user enters the name of the artist, the request to get all de details and then saved in the dataframes is represented in the following diagram:
mm("""
graph TD
    A[user_input] -->|Search| B(GET item 0)
    B --> |save artist_id| D{GET request}
    D -->|/artist/artist_id/albums| E[df album list]
    D --> F[df albums details]
    F --> E
    E --> |/artist/album_id/| F
""")
2.4 Albums
In order to obtain the albums of an artist, I will use the /artists/{id}/albums API section. In the next part I use the API to get the info and a simple while loop for pagination. I will use the limit parameter to limit the number of albums per request to 50 and the offset parameter to move through the pages. I will also use the include_groups parameter to only get the albums and not the singles or compilations.
The structure of the json object delivered by /artists/{id}/albums can be found at this link. Link
#extract all albums of artist
r_albums = requests.get(base_url + 'artists/' + artist_id + '/albums?market=US', headers=header, params={'limit':50, 'include_groups':'album'})
r_albums=r_albums.json()
df_albums=json_normalize(r_albums['items'])
#get next page
while r_albums['next']:
    r_albums = requests.get(r_albums['next'], headers=header)
    r_albums=r_albums.json()
    df_albums=df_albums.append(json_normalize(r_albums['items']))
df_albums=df_albums.drop(['album_type',
                          'artists',
                          'href',
                          'images',
                          'release_date_precision',
                          'external_urls.spotify',
                          'uri',
                          'type'],axis=1)
df_albums['Release Date'] = df_albums['release_date'].apply(lambda x: x[:4])
df_albums.head(5)| album_group | id | name | release_date | total_tracks | Release Date | |
|---|---|---|---|---|---|---|
| 0 | album | 2PBaIv21OWCmecNenZionV | Moving Pictures (40th Anniversary Super Deluxe) | 2022-04-15 | 26 | 2022 |
| 1 | album | 06hsxtm7Y1gDM5sNliCD5d | Permanent Waves (40th Anniversary) | 2020-05-29 | 18 | 2020 |
| 2 | album | 5G0G9TLLWr8n1abpY4ihmy | Hemispheres (40th Anniversary) | 2018-11-16 | 14 | 2018 |
| 3 | album | 3bMJQ8LQWi42IAhVPP0M9O | A Farewell To Kings (40th Anniversary Deluxe E... | 2017-09-01 | 26 | 2017 |
| 4 | album | 6q4SMJ8ggxBVrCzPSnDl7c | 2112 (40 Anniversary) | 2016-12-09 | 19 | 2016 |
Despite having used include_groups, Spotify’s response contains some live albums, anniversary editions and others that generate noise in the data. Since my goal is to get only the studio albums, the first step is to delete the albums I don’t need.
#delete live albums
df_albums=df_albums[~df_albums['name'].str.contains('Live|Anniversary|Remix|Tour|Stage|Retrospective|Chronicles|R30|A Show Of Hands|Closer')]
#loower case all names
df_albums['name']=df_albums['name'].str.lower()
df_albums.reset_index(drop=True, inplace=True)
df_albums.head(5)| album_group | id | name | release_date | total_tracks | Release Date | |
|---|---|---|---|---|---|---|
| 0 | album | 744i0LypfMwHHrKhzsqAx0 | clockwork angels | 2012-06-11 | 12 | 2012 |
| 1 | album | 7hgcHQbB7xYr75qPPulfro | snakes & arrows | 2007-04-27 | 13 | 2007 |
| 2 | album | 0mT6ezOOTIUucAF9csghFE | feedback | 2004-06-29 | 8 | 2004 |
| 3 | album | 5fwkYtHrckROAs4ALRJ2Cz | test for echo (2004 remaster) | 1996-09-06 | 11 | 1996 |
| 4 | album | 6JNHWbFco4bnRP5ybKGriN | counterparts (2004 remaster) | 1993-09-28 | 11 | 1993 |
2.5 Popularity
In order to get the popularity of every album, I use the /albums/{id} API section and to concatenate in the dataframe.
#get the popularity of every album
df_albums['popularity'] = df_albums['id'].apply(lambda x: requests.get(base_url + 'albums/' + x, headers=header).json()['popularity'])
df_albums.head(5)| album_group | id | name | release_date | total_tracks | Release Date | popularity | |
|---|---|---|---|---|---|---|---|
| 0 | album | 744i0LypfMwHHrKhzsqAx0 | clockwork angels | 2012-06-11 | 12 | 2012 | 37 |
| 1 | album | 7hgcHQbB7xYr75qPPulfro | snakes & arrows | 2007-04-27 | 13 | 2007 | 34 |
| 2 | album | 0mT6ezOOTIUucAF9csghFE | feedback | 2004-06-29 | 8 | 2004 | 28 |
| 3 | album | 5fwkYtHrckROAs4ALRJ2Cz | test for echo (2004 remaster) | 1996-09-06 | 11 | 1996 | 33 |
| 4 | album | 6JNHWbFco4bnRP5ybKGriN | counterparts (2004 remaster) | 1993-09-28 | 11 | 1993 | 41 |
2.6 Graphs
The first graph shows the number of albums per year and the number of tracks per album.
#group by name and release date
df_tracks_and_year=df_albums.groupby(['name']).agg({'total_tracks':'first','Release Date':'first', 'popularity':'first'})
#sort by release date
df_tracks_and_year=df_tracks_and_year.sort_values(by=['Release Date'])
#reset index
df_tracks_and_year.reset_index(drop=True, inplace=True)
#number of albums per year
fig = px.scatter(df_tracks_and_year,
                 x='Release Date',
                 y='total_tracks',
                 color='Release Date',
                 color_continuous_scale='Viridis',
                 marginal_x="histogram",
                 labels={'x':'Release year', 'y':'Number of Tracks'},
                 template="ggplot2" )
fig.update_layout(title='Number of Tracks per Album',
                  width=700,
                  height=600)
fig.show()- Does the era affect the amount of tracks that an album had?
R:// Yes! The number of tracks per album has increased over time. The first album had 8 tracks and the last one 12 tracks.
#sotring by release date
df_albums=df_albums.sort_values(by=['Release Date'], ascending=True)
#heatmap of popularity, release date and number of tracks
fig = px.density_heatmap(df_albums,
                         x="Release Date",
                         y="popularity",
                         z="total_tracks",
                         #histfunc="max",
                         color_continuous_scale="Blues",
                         labels={'popularity':'Popularity', 'Release Date':'Release Date', 'total_tracks':'Number of Tracks'},
                         template="ggplot2")
fig.update_layout(title='Heatmap: Release date, popularity and number of tracks per album')
fig.layout['coloraxis']['colorbar']['title'] = 'Number of Tracks'
fig.update_layout(width=700, height=600)
fig.show()
The popularity of an album is it affected by the era? R:// Yes! The popularity of an album is affected by the era. The most popular albums were released in the 70s.
The number of tracks it’s related to the popularity of the album? R:// Yes! The more tracks an album has, the less popular it is.
2.7 Conclusion
The most popular years of Rush were the 70s, in the beginning of the band. As time increased, the songs became shorter and the albums did not enjoy as much popularity.