7 PowerBI and python
I think that despite having all the data, there is still a lack of it that Spotify can give me about my listening habits. For this I will use the API to extract the audio features of the songs, the extracted data will be the following:
- Instrumentalness
- Acousticness
- Danceability
- Energy
- Liveness
- Speechiness
Documentation of these factors can be found here
To extract this data I use the following python script.
import pandas as pd
import requests
# Function to get the token
def get_token():
    url = 'https://accounts.spotify.com/api/token'
    auth_response = requests.post(url, {
        'grant_type': 'client_credentials',
        'client_id': 'xxxxxxxxxxxxxxxxxxxxxxxxxxxxxxxx',
        'client_secret': 'xxxxxxxxxxxxxxxxxxxxxxxxxxxxxxxx',
    })
    if auth_response.status_code != 200:
        raise Exception('Error getting token')
    else:
        auth_response_data = auth_response.json()
        return auth_response_data['access_token']
# Get token
access_token = get_token()
header = {
    'Authorization': 'Bearer {token}'.format(token=access_token),
    'accept':'application/json'
}
base_url = 'https://api.spotify.com/v1/audio-features/'
dataframe=pd.read_csv('endsong_9 copy.csv')
index_startpoint=0
#get the audio features for each song strating from the index_startpoint
for index, row in dataframe.iterrows():
    if index >= index_startpoint:
        url = base_url + row['track_id']
        response = requests.get(url, headers=header)
        if response.status_code != 200:
            print('Error getting data')
        else:
            response_data = response.json()
            dataframe.loc[index, 'acousticness'] = response_data['acousticness']
            dataframe.loc[index, 'danceability'] = response_data['danceability']
            dataframe.loc[index, 'energy'] = response_data['energy']
            dataframe.loc[index, 'instrumentalness'] = response_data['instrumentalness']
            dataframe.loc[index, 'liveness'] = response_data['liveness']
            dataframe.loc[index, 'loudness'] = response_data['loudness']
            dataframe.loc[index, 'speechiness'] = response_data['speechiness']
            dataframe.loc[index, 'tempo'] = response_data['tempo']
            dataframe.loc[index, 'valence'] = response_data['valence']
            dataframe.loc[index, 'duration_ms'] = response_data['duration_ms']
            dataframe.loc[index, 'time_signature'] = response_data['time_signature']
            dataframe.loc[index, 'key'] = response_data['key']
            dataframe.loc[index, 'mode'] = response_data['mode']
            #save log in file
            with open('log.log', 'a') as f:
                f.write('Song: ' + str(index) + ' - ' + dataframe['track_id'][index])
#save the dataframe in a csv file
dataframe.to_csv('Audio_Features.csv', index=False)
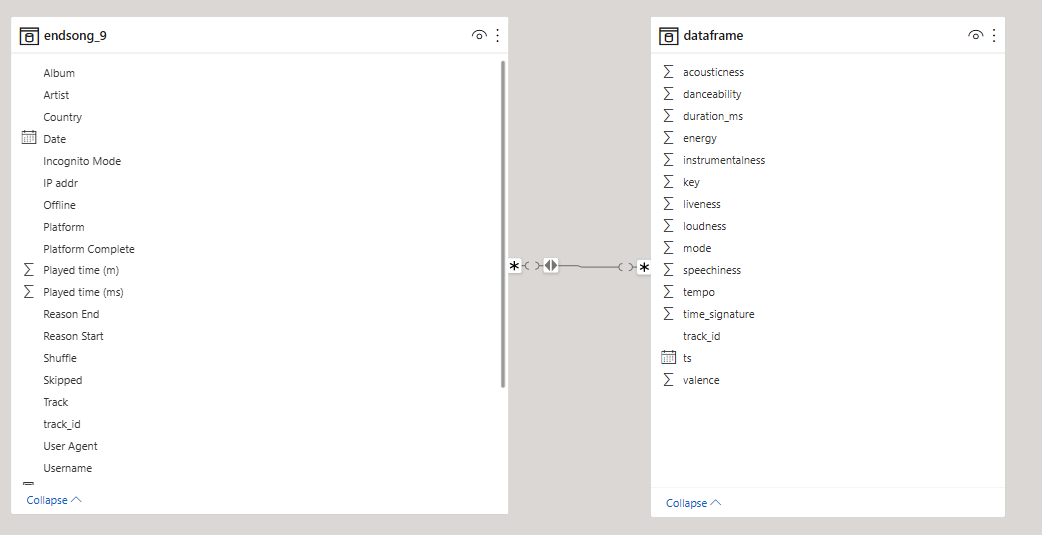
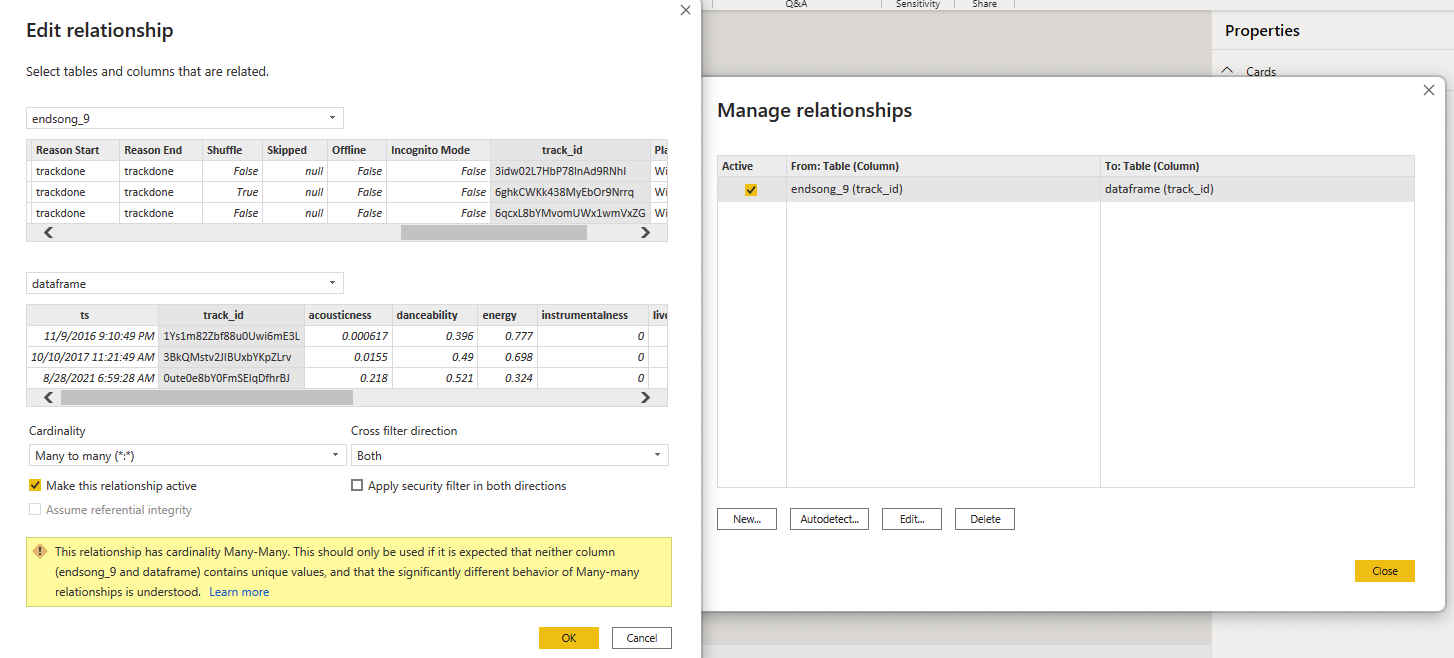
This resulting dataframe must be imported into PowerBi and the relationships with the previous dataset must be created:


7.0.1 Radar Chart
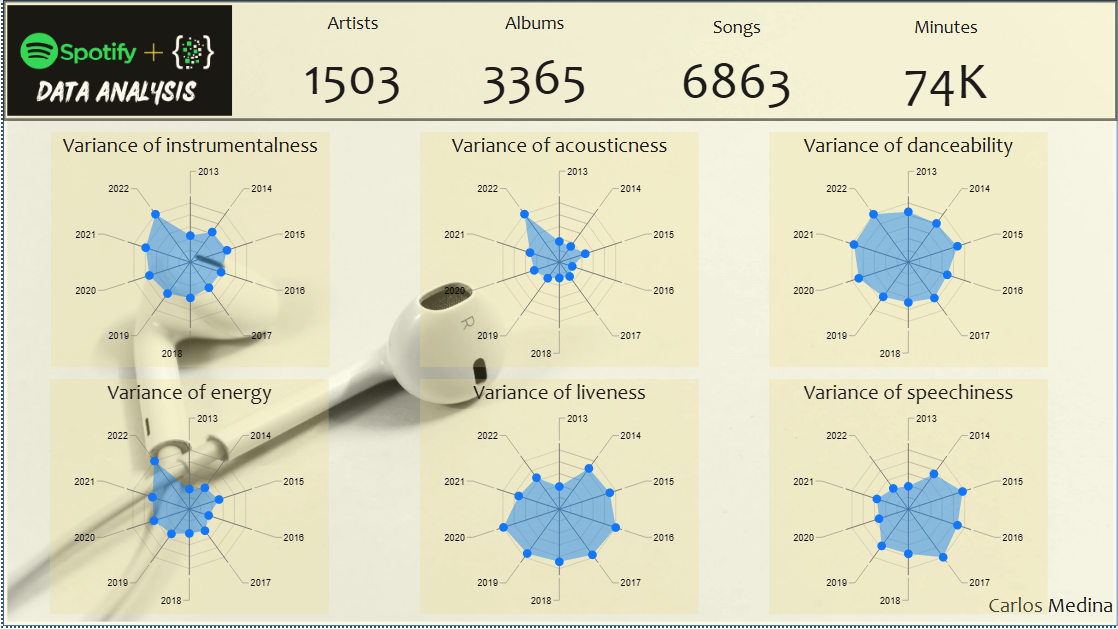
With the help of some radar charts, I can show the variance of these values over the years. The final result is the following:

If you want to download the PowerBI file (pbix) you can do it from this link