from pandas import json_normalize
import requests
import plotly.express as px
import plotly.io as pio
pio.renderers.default = "plotly_mimetype+notebook_connected"
import pandas as pd
from pycountry_convert import country_alpha2_to_country_name, country_name_to_country_alpha3
import base64
from IPython.display import Image, display
def mm(graph):
graphbytes = graph.encode("ascii")
base64_bytes = base64.b64encode(graphbytes)
base64_string = base64_bytes.decode("ascii")
display(Image(url="https://mermaid.ink/img/" + base64_string))3 Geolocation analysis
By now we know that Rush was a very popular band in the 70s and 80s mainly for their short songs, however, their focus was more towards long songs especially in their first albums. As time passed the band dedicated themselves to making not so long songs, but the albums had more and more.
Now, what can Spotify tell us about geolocation? In this part I will use Spotify’s “markets” field to determine if Rush albums are in all countries.
GET /artist/{id}
GET /artist/{id}/albums| Parameter | Type | Description |
|---|---|---|
| id (required) | string |
Get Spotify catalog information for a single artist identified by their unique Spotify ID.The ID of the artist. |
| albums | string |
Get Spotify catalog information about an artist’s albums. |
3.1 Libraries
Import the libraries I will need:
This is the section of the authentication and generation of the token that was already explained in the first section
CLIENT_ID = '81e800e81ecf4997b5b9fb12efeb3ff2'
CLIENT_SECRET = '0e4364f440f148779d8a9f17976ecf1b'
def get_token():
    url = 'https://accounts.spotify.com/api/token'
    auth_response = requests.post(url, {
        'grant_type': 'client_credentials',
        'client_id': CLIENT_ID,
        'client_secret': CLIENT_SECRET,
    })
    if auth_response.status_code != 200:
        raise Exception('Error getting token')
    else:
        auth_response_data = auth_response.json()
        return auth_response_data['access_token']
access_token = get_token()
header = {
    'Authorization': 'Bearer {token}'.format(token=access_token),
    'accept':'application/json'
}
base_url = 'https://api.spotify.com/v1/'
#ask for user input for artist name
artist_name = input('Enter artist name: ')
print('the artist name is: ', artist_name)
#get artist id
artist_id = requests.get(base_url + 'search?q={}&type=artist'.format(artist_name), headers=header).json()['artists']['items'][0]['id']the artist name is: Rush3.2 Workflow
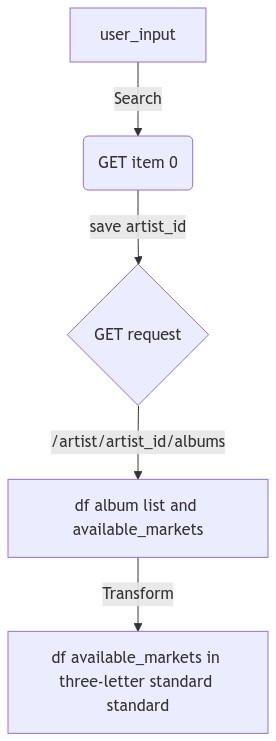
The workflow from when the user enters the name of the artist, the request to get all de details and then transform the two-letters country code to the full name of the country is the following:
mm("""
graph TD
    A[user_input] -->|Search| B(GET item 0)
    B --> |save artist_id| D{GET request}
    D -->|/artist/artist_id/albums| E[df album list and available_markets]
    E --> |Transform | F[df available_markets in three-letter standard standard]
""")
3.3 Get the data
To get all the IDs and markets available for albums under the Rush name, I have to make a request to /albums.
As in the previous sections I will remove some columns that I don’t need and I will extract the year of publication in a separate column.
#extract all albums of artist
r_albums = requests.get(base_url + 'artists/' + artist_id + '/albums', headers=header, params={'limit':50, 'include_groups':'album'})
r_albums=r_albums.json()
df_albums=json_normalize(r_albums['items'])
#get next page
while r_albums['next']:
    r_albums = requests.get(r_albums['next'], headers=header)
    r_albums=r_albums.json()
    df_albums=df_albums.append(json_normalize(r_albums['items']))
df_albums=df_albums.drop(['album_type',
                          'artists',
                          'href',
                          'images',
                          'release_date_precision',
                          'external_urls.spotify',
                          'uri',
                          'type'],axis=1)
df_albums['Release Date'] = df_albums['release_date'].apply(lambda x: x[:4])
df_albums.head(5)| album_group | available_markets | id | name | release_date | total_tracks | Release Date | |
|---|---|---|---|---|---|---|---|
| 0 | album | [CA, JP] | 5nZ5I0gA3x6KEkIpHQWw4l | Moving Pictures (40th Anniversary) | 2022-04-15 | 26 | 2022 |
| 1 | album | [AD, AE, AG, AL, AM, AO, AR, AT, AU, AZ, BA, B... | 2PBaIv21OWCmecNenZionV | Moving Pictures (40th Anniversary Super Deluxe) | 2022-04-15 | 26 | 2022 |
| 2 | album | [CA, JP] | 3EUhoI6JRdxYzml9gHWzJI | Permanent Waves (40th Anniversary) | 2020-05-29 | 18 | 2020 |
| 3 | album | [AD, AE, AG, AL, AM, AO, AR, AT, AU, AZ, BA, B... | 06hsxtm7Y1gDM5sNliCD5d | Permanent Waves (40th Anniversary) | 2020-05-29 | 18 | 2020 |
| 4 | album | [CA] | 0UQOn626iDanxtIZlnQyUK | Hemispheres (40th Anniversary) | 2018-11-16 | 14 | 2018 |
3.4 How many markets can each album have?
#COUNT NUMBER OF ALBUMS AVAILABLE per MARKET
df_albums['count_available_markets'] = df_albums['available_markets'].apply(lambda x: len(x))
#sort count_available_markets
df_albums = df_albums.sort_values(by=['Release Date'], ascending=True)
df_albums = df_albums.reset_index(drop=True)
df_albums.head(5)| album_group | available_markets | id | name | release_date | total_tracks | Release Date | count_available_markets | |
|---|---|---|---|---|---|---|---|---|
| 0 | album | [AD, AE, AL, AM, AO, AR, AT, AU, AZ, BA, BD, B... | 43OvqHDAEOUKfHNFPCgsvf | The First Us Tours | 1974 | 23 | 1974 | 161 |
| 1 | album | [JP] | 5foiAR3bxvhZ2660J8Nntg | Rush | 1974-03-01 | 8 | 1974 | 1 |
| 2 | album | [CA] | 0lZRCf7prVEVVYjH5Im0TS | Rush | 1974-01-01 | 8 | 1974 | 1 |
| 3 | album | [AD, AE, AG, AL, AM, AO, AR, AT, AU, AZ, BA, B... | 57ystaP7WpAOxvCxKFxByS | Rush | 1974-01-01 | 8 | 1974 | 178 |
| 4 | album | [JP] | 4FZkxs4KHgwYJQ94cWMFqz | Fly by Night | 1975-02-15 | 8 | 1975 | 1 |
The following graph shows:
- How many releases are there for each album
- In how many markets is it available
They are organized by year of release
#density plot between release date and count_available_markets
fig = px.density_heatmap(df_albums,
                         x="name",
                         y="count_available_markets",
                         marginal_x="histogram",
                         template="ggplot2")
fig.update_layout(title='Top Tracks and Albums of {}'.format(artist_name),
                  width=1500,
                  height=800,
                  xaxis_title='Albums',
                  yaxis_title='Number of Available Markets')
fig.update_layout(width=700, height=600)
fig.show()
3.5 What is the market with more albums?
There are several points here: I must take into account that Spotify returns me a list of countries per album, I must first extract that list and convert it into a dataframe. In the end I will have a line for each album and market available.
df_available_markets=pd.DataFrame(df_albums['available_markets'].apply(lambda x: pd.Series(x)).stack().reset_index(level=1, drop=True), columns=['available_markets'])
#add the album name to the dataframe
df_available_markets['album_name'] = df_albums['name']
df_available_markets=df_available_markets.reset_index()
df_available_markets.head(5)| index | available_markets | album_name | |
|---|---|---|---|
| 0 | 0 | AD | The First Us Tours |
| 1 | 0 | AE | The First Us Tours |
| 2 | 0 | AL | The First Us Tours |
| 3 | 0 | AM | The First Us Tours |
| 4 | 0 | AO | The First Us Tours |
Second point, to be able to work by market/country, I must group the data using this parameter.
#count number of albums per country
df_country = df_available_markets.groupby(['available_markets']).count()
df_country = df_country.reset_index()
df_country = df_country.rename(columns={'index':'count'})
df_country = df_country.sort_values(by=['count'], ascending=False)
df_country = df_country.reset_index(drop=True)
#drop album_name column
df_country = df_country.drop(['album_name'], axis=1)
df_country.head(5)| available_markets | count | |
|---|---|---|
| 0 | CA | 43 |
| 1 | DM | 40 |
| 2 | GT | 40 |
| 3 | TT | 40 |
| 4 | NI | 40 |
Third point, Kosovo is a country recognized by Spotify, but not by the international standard which Plotly uses, so to avoid errors, I remove it.
#drop the XK country
df_country = df_country.drop(df_country[df_country['available_markets'] == 'XK'].index)
df_country = df_country.reset_index(drop=True)
And finally, Spotify delivers the countries in a two-letter standard, but Plotly works with a three-letter standard, to solve this problem I use the pycountry-convert library
#add country name to dataframe
df_country['country_name'] = df_country['available_markets'].apply(lambda x: country_alpha2_to_country_name(x))
df_country.head(5)| available_markets | count | country_name | |
|---|---|---|---|
| 0 | CA | 43 | Canada |
| 1 | DM | 40 | Dominica |
| 2 | GT | 40 | Guatemala |
| 3 | TT | 40 | Trinidad and Tobago |
| 4 | NI | 40 | Nicaragua |
#graph
fig = px.choropleth(df_country, locations="country_code",
                    color="count", # lifeExp is a column of gapminder
                    hover_name="country_name", # column to add to hover information
                    color_continuous_scale=px.colors.sequential.Plasma,
                    template="ggplot2")
fig.update_layout(title='Country distribution by {}'.format(artist_name))
fig.update_layout(width=700, height=600)
fig.show()
The graph above shows several things:
- The country with the most albums available is Canada, it’s not surprising given that Rush is a Canadian band.
- Most countries have the same number of albums.
- And apparently Spotify is not present in certain countries where the account is 0.