5 Dashboard template creation
To create a dashboard in PowerBi there are many steps and how to execute them can vary depending on the analyst, I personally like to create the aesthetic part of the dashboard first and then create the graphs.
5.1 Template creation
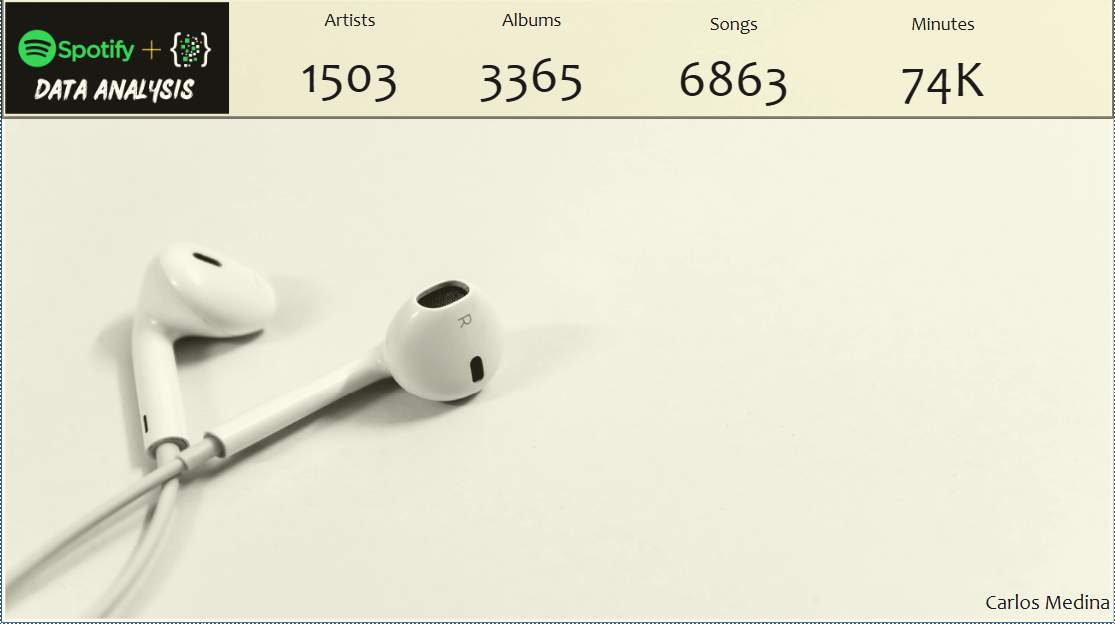
In this I chose to create a basic template which contains:
- Logo
- Background image
- Shapes to add transparencies in the colors
- Basic KPI of my musical tendencies.
The template is created in a separate page and then I can use it in the other pages. It finally looks like this:

(I am a colorblind person, please bear with me.)
The KPIs shown were created with the distinct count, for example, if an artist was listened to many times, it would only be counted once.